26 August 2009

PutCall Ratio Divinations

The put/call ratio: Is it it predictive or reactive? Maybe a bit of both, just as I think VIX is. But like VIX and volatility in general, it tends to be mean reverting. Extreme readings don't often last a hell of a long time and are often the harbinger of a reversal - or at least a consolidation or retracement in the prevailing trend.

For the medium term view, and the P/C being a very volatile figure, I like the 20DMA of the equity only put/call ratio to find extreme readings.

Here is the last three years of this figure in green, plotted against the SP500:


A close examination highlights the inverse correlation.

The interesting thing for me is that the 20DMA of the equity only put/call ratio is now at its lowest level in the three years of the plot. That in and of itself probably means zip in the predictive sense, but if one wanted to make a case for a pause/consolidation/retracement in the indices sometime very soon, this indicator certainly would add some weight to that hypothesis.

Lots of bears are talking another major down leg, and generally I'm still a bear too, but I doubt we'll see too much downside in the medium term. But I'm making the case for a short term top somewhere around about here.

Some nice sideways action would do my spirit (and my index position) the world of good.

24 August 2009

Futures Options - Part 3

Judging by my site stats since starting on futures options, it doesn't seem like there is a lot of interest in them. That's a bit of a shame in my opinion, because there are some great opportunities to trade in the futures/commodities markets.

While there is nothing at all wrong with stock options and I will continue to trade them, commodity options can be far more suitable for some investors/traders, particularly if you like writing options.

The seasonal tendencies in commodity markets offer some unique opportunities, not just for speculating on direction via direct futures and/or long options and option spreads, but I think the most reliably profitable trades are the so-called "non-seasonal" option write as described in Stuart Johnston's "Trading Options to Win".

This is basically writing options on the opposite side of a seasonal tendency, or even just a seasonal non-tendency. This is a trade that has history and statistics on it's side and with discipline, is an excellent way to trade.

One of these to follow in the near future that I have alludes to already on the blog, is the seasonal bull in gold which begins around the 9th of Sept and continues to the first week in October.

I'll wrap up this "difference between stock and futures options" theme with a couple more points and then it's DYOR.

Tick Size

Each commodity future has its own minimum tick size that will relates to the price per bushel/tonne/bale/whatever and they are all different. As an example, the grain complex is quotes in cents per bushel (contract size is 5,000 bushels) with a minimum tick size of 1/4 of a cent. This means each cent movement on a contact of , say corn, is worth $50.00, while the minimum tick size is $12.50.

One would think the options would be quoted the same way. Nope. Grain options have a minimum tick size of 1/8 of a cent, not 1/4 cent. No big deal, but something to be aware of and something to research at the relevant exchange's site before trading them.

Margin

If you like writing options, you can leave Reg T behind with futures option. Futures options margins are calculated using a ludicrously complex algorithm called SPAN, which is short for
Standard Portfolio ANalysis of Risk and better known to stock option traders as portfolio margin.

As a general guide, short option premiums on ATM or OTM options will generally be less than their corresponding futures margins, which is quite generous.

There's enough there for folks to be aware that there are significant differences between stock and futures options and my best advice is to aways refer to the exchanges website to be sure of contract specs and expiry.


20 August 2009

Futures Options - Part 2

This is Part 2 of our look at futures options.

Contract Size.

Whereas a stock option is a right to buy or sell a parcel of a certain number of shares, a futures option is the right to buy or sell a futures contract. This is quite easy then, one option = one future. As a futures contract it is the right to buy or sell another derivative contract, this explains some of the various nuances of futures option.

Expiry

Stock options all typically expire on the same day in the monthly cycle. In the US, this is the third Friday of the month and all stock options are on a certain expiry cycle as per THIS LINK. It's all pretty easy to work out once you know how it works.

Futures options are different. While the US stock index options expire on the same day as stock options, commodity futures options all have there own expiration nuances that can take some time to get used to. Many commodity options actually expire the month before the contract month. For example, The December 2009 cocoa future expires on the 15th Dec, but the December 2009 cocoa option expires on the 6th November. The reason for this in this particular contract is that the option expires before the first notice day, where holders of futures contracts are required to notify their intentions for delivery of the physical commodity (Speculative traders will have exited this contract before then).

Every futures option is different and the exchanges website should be consulted as to the exact expiry of the option concerned. For a handy 2009 expiration guide for futures and their options, have a look here at Daniels Trading have put together.

Exercise

This is another nuance which is different for each commodity.

A stock option relates to the physical delivery of a parcel of shares. When you exercise or are assigned, you deliver or accept delivery of the number of shares in question.

As stated above, a futures option is an option on a futures contract. That is where the certainty ends.

Firstly there are regular expiry contracts and then there are serial expiry contracts. A regular exiry is an option whose expiry correlates to the futures expiry (even if it expires the month before). An example is the cocoa option mentioned above; the December option correlates to the December future, both are Z expiry.

However, futures options may have expiries between futures contract months. For example, if you look at our cocoa options example, there are options which are V (October) and X (November) expiry that do not have their own futures expiry. These are called serial expiry options. These are options on the Z (December) contract.

Confused?

It doesn't stop there. In some commodity options, the regular and serial expiry options may be settled in different ways. In some cash settled futures, the regular expiry options are settled in cash, whereas the serial options are settled with the futures contract.

The key is to always refer to the exchanges website to make sure of the expiry date and the settlement terms.

Enough for now, stay tuned for part 3

19 August 2009

Future Options - A Bit Different

With Liberty trading Group running all over the shop promoting the writing of commodity futures options, I thought it would be a good time to highlight some of the differences between futures options and stock options.

This first post is on pricing.

Anyone who looks at payoff diagrams will notice a slight difference in how futures options are priced. The most obvious diagram to look at is a straight out ATM long call and the corresponding long put.

Supposing you have two instruments with all things being identical, i.e. all inputs into the model are the same, but one is a futures option and the other a stock option. You will notice that stock option calls are more expensive than the futures option call. Likewise, the stock option puts will be cheaper than the futures option puts.

Also, if exactly at the money, the futures options call and put prices will be virtually identical.

Furthermore, again if exactly at the money, you will notice that stock option calls will have a delta of greater than 0.5, with the negative delta of puts less than 0.5 (the absolute values of both should add up to 1), whereas the futures option will be very much closer to, if not exactly 0.5 each.

The reason for this is the cost of carry priced into the options. Stock options make the assumption that someone is holding stock and is entitled to be paid carrying costs in lieu of risk free interest, whereas a futures option is an option on another derivative contract. This means that carrying costs priced into futures options are negligible.

There are a few other differences which I'll be going over ion the next few days - stay tuned

18 August 2009

Stocks Good, Options Bad

How many times have you heard someone pontificate on the subject of "stocks are good, options (or futures) are bad with the contention that:

  1. Options (futures) are a zero sum game, for you to win, someone has to lose. They do not create any net wealth.
  2. Stocks are a positive sum game. When you buy shares you are assisting the company to raise capital to build infrastructure, employ people and create value and wealth.

Anyone who's been around markets longer than 3 days will have heard this, or some variation of it It's a very persuasive argument used by many civic minded folk to avoid derivatives as they must be the spawn of Satan, stocks are virtuous. There is only one problem with this argument.

It's bullshit!

If one buys stock on the open market, not one dram, not one iota, not a jot of that capital goes to the company in question at all. While it's true that stock and bond markets are mechanisms for companies to raise capital, the vast majority of investors probably never contribute to this process at all. Or if so, it is a pittance.

Why? Companies only raise money through the issuance of NEW shares or bonds. Unless participating in an IPO or bond offering, the company will never see a cent of your money.

These are a miniscule proportion of transactions, with the overwhelming majority of transaction being the exchange of existing shares between specialists, marketmakers, institutions, traders and investors. The actual company whose shares we are trading is outside this loop, apart from you actually removing capital from the company if they pay you a dividend.

That means that for the most part, share trading is also a zero sum game (actually negative sum because of tranaction costs), capital profits come as opportunity cost for the seller.

The wealth creation bit is performed by the company itself, not the owner of shares purchased second hand on an exchange.

Ergo, the trading of options (or futures) or shares are equal in virtue, none have any moral advantage over the other.


17 August 2009

Synthetic Equivalence - What It Ain't.

I've posted a bit on synthetic equivalence a few time in recent months, both here on the blog and on some message boards. Some people have a few trouble with this concept even when proven mathematically, so thought I would talk a bit on what it is and what it isn't.

For what it is, I'll leave the explaining to Charles Cottle, from The Hidden Reality:

There is the raw (actual)position consisting of the exact options that contribute to an overall strategy. For every raw position there are a number of alternative positions called synthetic positions (synthetics). A synthetic position has the same risk profile as its raw position and achieves the same objectives.


What that means is that the risk profile of an option strategy can be duplicated via different combinations of options and/or stocks. A few examples:

A covered call is a synthetic naked short put
A married put is a synthetic long call
A collar is a synthetic vertical spread

There are dozens of combinations that can duplicate the risk profile of different combinations.

The problem seems to be that some people feel that the positions must me identical in every respect to be synthetically equivalent. The most common objection is that of different capital/margin requirements. - that if one position needed more money to trade than the other, they can't be synthetically equivalent.

One fellow didn't feel that a long call/short corresponding put wasn't synthetically equivalent to long stock, because he could get the option combo on margin, whereas the stock required the full investment of the value of the stock. That *may* be true for some traders. But it is certainly not true for others due to different margin rules, haircuts or whatever.

The logical extrapolation of that logic would be that stock bought on margin is not the same as stock bought for cash.

In any case, capital/margin requirements are not relevant to synthetic equivalence. What is relevant, it the risk profile... the payoff diagram adjusted for cost of carry and dividends if necessary.

Capital/Margin is not considered when looking at synthetic equivalence.

How to Trade VIX

There seems to be more and more interest in directly trading the VIX lately. I've not succumbed myself, but of course am a keen observer. The most sensible commentary does not come from Bloomberg or the clowns on CNBC, but from Adam Warner's Daily Options Report and Bill Luby's VIX And More. These guys do actually trade, contrary to what on suspects with the MSM pundits.

There is a good post today over at VIX and More on how to trade the VIX - worth a gander if interested. How to Trade the VIX.

13 August 2009

A CNN Bearfest

In the absence of anything worthwhile to say today, how about this bearfest from a couple of weeks ago.

Niall Ferguson, Nouriel Roubini and Mortimer Zuckerman revive the Apocalypse.

12 August 2009

Gold Doldrums

A few days ago I highlighted the rising implied volatility of gold options. That seems to have been the high for gold IV for now, as IVs have settled back to the high teens.

Nothing more than a short term IV spike which has been fairly typical.


Meanwhile, realized volatility remains low, much lower than IV but as discussed before, there are good reasons for this.

Gold seems to be rooted in the doldrums, but there is always that September seasonal tendency to look out for and then there is the inflation hedge argument... QE and all that.

My purely baseless guess is that gold dribbles along for a while; until it doesn't.

11 August 2009

Credit Spread Myths

So a few posts back I started on a bit of a rant on the BS being passed off as information on credit spreads and gave up about half way through. As the fashion for option bloggers is to do the odd video these days, I decided to finish the job in a video.

I've picked on the same article, because it encaspulates most of the nonsense out there in just two or three paragraphs and a few bullet points. I don't have anything to sell, so no need to be wary about any marketing at the end.


10 August 2009

Options Profits Reportage

Those folks that have been around options for any length of time, might have noticed the way in which options newsletters and course sellers report profits (but never losses :))from options.

The first trend goes something like:

...top-performing 2009 trades scored 844%, 416%, 390% and 227%

Is it possible? Of course it is. It might be true, it might accurately reflect the facts, but is it appropriate to report it in this way?

Firstly, big wins are nice, but on their own say nothing unless in context with a string of trades taken by the trader. The bottom line is that the sum of winning trades must exceed the sum of losing trades for there to be a profit at the end of the year. This is what's never reported on. This big outlier wins are important of course, but what is more important is the number and scale of losses in comparison. Mathematical expectancy is what's important.

The second point is the capital allocation to these option trades. If a stock trader allocates a $10,000 position size to each trade, how much capital should the trader allocate to a long option trade?

Anybody that buys $10,000 worth of options in place of $10,000 worth of stocks, probably should be committed; particularly if they are out of the money option punts.

Obviously if the trader uses some sort of position sizing algorithm based on capital at risk (fixed fractional or similar), the capital used in each trade will be commensurately smaller with the option trade.

Put these two points together and those huge percentage wins take on an entirely different perspective. The question should be: What is the return on capital with reasonable risk control in place?

But that doesn't make for good advertising copy does it?

The second trend is the practice of annualizing profits. For example:

Net Premium: 2.70
Net Return: 3.8%
Annualised Return: 87%

If the trader could guarantee similar net returns with no gaps and possibility of losses, it might be a valid way of reporting losses.

But this is the real world, traders must deal with the reality of losing sometimes. Once again sums of wins versus sums of losses (AKA expectancy) applies. How many times does the trader win 3.8% and how many and what percentage losses does the trader suffer over the course of the year.

And on the niggly point of losses, should they also be reported on an annualized basis? That wouldn't make good advertising copy would it.

Imagine a 7% loss on a 4 week covered call annualized. That doesn't look so good. :(

The only thing important to any trader, whether trading options, stocks, or tiddly-winks, is the bottom line at the end of the year. That is, the return on the entire account. We trade options to hopefully improve that return over other methods of trading and investing, but there there is more to it than many vendors let on and more to it that what is reported in some blogs and options advertising.

I'm probably "preaching to the converted" mostly; obvious stuff to anyone who trades options seriously. It's still worth putting out there once in a while for new people coming in to Option Land to consider.

07 August 2009

Volatility? What Volatility?

In option land, volatility has a specific mathematical definition and is used in the various pricing models (Black Scholes et al). That definition is as follows - the annualized standard deviation of logarithmic daily change in price. I have highlighted "daily" because that's what it measures, the daily change of price.

Option volatility takes no account of the trendiness of the underlying instrument however.

Let say instrument (a) moves 1% up and 1% down alternately for 20 days in a row, but instrument (b) moves up 0.5% every day for twenty days. Instrument (a) finishes very close to where it started, hardly any nett movement at all, yet (b) is up over 10% higher after the 20 days.

According to the option volatility formula, the volatility measured over this time frame is much higher for (a) than for (b).

But depending on your precise option positions (b) could probably *feel* a lot more volatile than (a).

This is the feeling some may be having at the moment if trading delta neutral strategies on index options (or just about any stock option actually). Realized volatilities have been trending down for months, with 20 day historical volatility sitting at just ~16% as I write. Yet anyone with short gamma wing spreads or (gulp) short strangles is going to be *feeling* like they are in a volatile market.

Well actually, we are, if you use a different measure of volatility.

Plain old standard deviation, measures the deviation from the mean (and as used in Bollinger Bands) over a set time frame tells a different story. While it has nothing to do with option pricing, it does show how much price is moving around or a longer period of time.

Check out the chart below (NB Stockcharts doesn't have HV as used in option pricing models, but Average True Range is used a proxy, as it also measures the daily range): Over the last three months 30 day ATR has gradually been trending downwards, mimicking HV as use in OPMs, yet 30 day standard deviation is at a high over the time period.


This is telling us what we already know, that the Indices have been flying in one direction. Volatility over a period of time IS in fact high as measured by standard deviation, even though volatility of daily changes has been declining.

It's another dimension to volatility that we retail traders probably need to throw into the mix when making volatility projections. For us, option volatility is important for pricing, but may not tell the whole story when analysing potential trades.

06 August 2009

Covered Calls - Naked Puts Redux

About a month ago, I was opining opining that though covered calls and naked puts are synthetic equivalents, there may be valid structural or psychological reasons why a trader might use one over the other.

It might not surprise many that I am impressed by my own profundity in that discussion ;). *Some* other arguments on the merits of one over the other leave me underwhelmed however, most particularly when those arguments are chockers full of non-sequiturs, half truths and plain old BS. These of course are all over the place in Option Land, but I'll pick on a recent article published by an option book vendor.

In the article, the author recognised the synthetic equivalency of covered calls and naked puts (rare), but argues the superiority of CCs based on a load of old cobblers, to wit:

Here are the reasons I prefer covered call writing to naked put selling:
1- Many brokerages want the assurance to know that you have the ability to purchase the shares you are obligated to buy when selling the put. Therefore, they will require you to have an adequate amount of cash in your account to cover such an event. You will then have sold a cash-secured put and set aside the same amount of cash as the CC seller.

I don't see this as a disadvantage at all if the goal is conservative premium collection. As the author acknowledges, capital usage is the same. Therefore, there is no valid reason on this point to prefer covered calls.

2- The seller of a covered call captures all dividends distributed by the underlying corporation, the put seller does not. We’re not talking about a huge windfall here, but the cash is better in our pockets than someone else’s.

Just plain incorrect. Option pricing takes into account any pending dividend and option pricing cum-dividend and ex-dividend account for them. If you have a covered call position, the call premium will be cheaper to the tune of the dividend amount. You get the dividend via the stock, but you lose it via less call premium. I have an article on the effects of dividends for further information.

3- Selling covered calls allows the investor more flexibility. The most profit a naked put seller can generate is the premium on the option sale. A covered call writer can profit from the option premium PLUS additional share appreciation if an out-of-the-money strike is sold. That choice is available to the covered call writer but not to the naked put seller.

There is still no difference in payoff. If an OTM call is written, the *corresponding* ITM naked put can also be written, again with the same payoff diagram as the OTM covered call. Synthetic equivalence is maintained no matter what the strike price.

4- Early assignment is not an issue for CC writers because the option premium is not affected and possible additional upside appreciation is incorporated into your profits if an O-T-M strike was sold. For naked put sellers, early assignment could be a disaster. Imagine a stock gapping down, and the stock “put” to us at the $30 strike. The stock is plummeting and heading for the teens! The put seller wants to sell the stock before it loses more ground but perhaps the shares haven’t even hit his account yet. He may have to wait until the next day to sell the shares. One way of getting around this issue is to sell the shares short (selling before actually owning them). The problem with this solution is that average... investors will have a difficult time getting “shorting privileges” from their brokerage firm and may lack the sophistication necessary to manage such situations. Besides, who needs the headaches?

There are a couple of points here:

a) It's true that the naked put might be assigned early if there is zero extrinsic value, however the short put will have a delta of +1, or very close to it, and will be trading like the stock anyway. This will put the trader in a position of a substantial open loss for sure, but the author neglects to inform the reader that the covered call will be in the identical position of a large open loss. Once again, the positions will be the same.

b) The suggested response of shorting stock is incorrect for the stated goal of exiting the position, as you don't know if and/or when you will be assigned. You may just be flipping your deltas and have an open synthetic short call. That's not what the author intended. There is no law that says you have to hold the put till expiry or assignment. The best response if you want to exit the trade before possibly being assigned is just buy back the written put.

5- Those interested in option investing in tax sheltered accounts, will have an easier time establishing such accounts using covered call writing than any other form of options trading.

This isn't my field, but I am led to believe that cash covered naked puts are permissable in such tax sheltered accounts.

If people really want to trade covered calls over naked puts, fine, there may be valid reasons as I stated in my earlier article. No skin off my nose, but let's not justify it with misinformation and bullshit.

05 August 2009

Gold Volatility Popping

Gold volatilities, along with vols in just about everything have been in a steady tankage since the near Apocalypse in the latter part of 2008.

The following image is of 63 day, 20 day and 6 day historical volatilitities on GLD the gold ETF; the varying lookback periods serve as a look at the structural volatility of gold. The general level of HVs have come from ~50-60% down to sub 20%, effectively reducing by two thirds. It does look like HVs are bottoming out however.

This level of HV is not unusual, having visited these levels twice before since the inception of this ETF in late 2004, the observation at those points was that vols stayed pretty low for months before eventually popping.


So does this mean gold stays quiet for a few months? Maybe not. Two things to note going forward.

1/ The seasonal tendency of gold shows that September is traditionally when gold starts flying, because of jewellery demand at this time of year,apparantly. This chart from www.spectrumcommodities.com


Important thing about seasonals; it's a historical *tendency*. It doesn't mean gold WILL run higher during September.

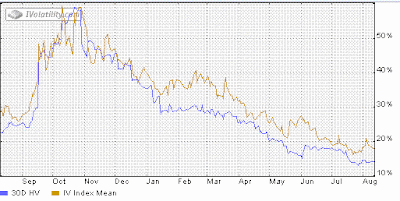
2/ Implied volatilities are popping, with IV a full ~50% higher than the 30 day HV plotted on the following graph.


So are option traders anticipating an increase in realized volatility? Well, IVs have consistently overestimated realized volatility; there's good reason for this with the ever present chance of Gold bugs going ape shit over one or another threat to world stability.

But an IV pop is what it is, it doesn't necessarily protend anything, as we can see from recent history, but reason to sit up and take notice. Perhaps the pop in the underlying a couple of days ago is responsible, perhaps gold bugs are about to party... again.

I think it's interesting juncture. I don't have a position in gold at the moment, but this looks an interesting time to watch more closely.