In option land, volatility has a specific mathematical definition and is used in the various pricing models (Black Scholes et al). That definition is as follows - the annualized standard deviation of logarithmic daily change in price. I have highlighted "daily" because that's what it measures, the daily change of price.
Option volatility takes no account of the trendiness of the underlying instrument however.
Let say instrument (a) moves 1% up and 1% down alternately for 20 days in a row, but instrument (b) moves up 0.5% every day for twenty days. Instrument (a) finishes very close to where it started, hardly any nett movement at all, yet (b) is up over 10% higher after the 20 days.
According to the option volatility formula, the volatility measured over this time frame is much higher for (a) than for (b).
But depending on your precise option positions (b) could probably *feel* a lot more volatile than (a).
This is the feeling some may be having at the moment if trading delta neutral strategies on index options (or just about any stock option actually). Realized volatilities have been trending down for months, with 20 day historical volatility sitting at just ~16% as I write. Yet anyone with short gamma wing spreads or (gulp) short strangles is going to be *feeling* like they are in a volatile market.
Well actually, we are, if you use a different measure of volatility.
Plain old standard deviation, measures the deviation from the mean (and as used in Bollinger Bands) over a set time frame tells a different story. While it has nothing to do with option pricing, it does show how much price is moving around or a longer period of time.
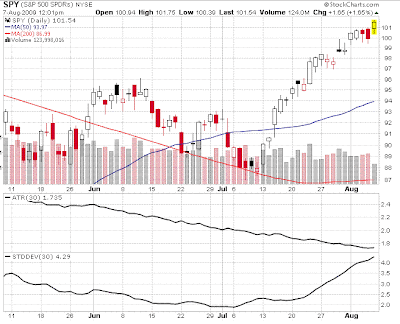
Check out the chart below (NB Stockcharts doesn't have HV as used in option pricing models, but Average True Range is used a proxy, as it also measures the daily range): Over the last three months 30 day ATR has gradually been trending downwards, mimicking HV as use in OPMs, yet 30 day standard deviation is at a high over the time period.

This is telling us what we already know, that the Indices have been flying in one direction. Volatility over a period of time IS in fact high as measured by standard deviation, even though volatility of daily changes has been declining.
It's another dimension to volatility that we retail traders probably need to throw into the mix when making volatility projections. For us, option volatility is important for pricing, but may not tell the whole story when analysing potential trades.
2 comments:
Wayne,
I am not sure if you are familiar with Jeff Augen's work?
He would profile stock movements in standard deviation terms to differentiate stocks with the same historical vol, to observe the "riskiness" of the underlying.
Mazz
Hi Mazza,
I haven't read any of his work.
I'll look him up.
Thanks
Wayne
PS Brilliant sleuthing on that other blog :)))
Post a Comment