Showing posts with label Volatility Watch. Show all posts

02 November 2009

November Soothsaying... Or Not.

As October trading is over it's time to look forward to the next month with reference to our new monthly pivots now set in stone, with the last trading day in October adding a fair bit of interest to the equation.

The monthly pivots have been very influential on the resistance side of the equation, but with scarcely any relevance at all on the support side. This is fairly expected in a stong uptrend.

click to enlarge


First line of resistance is 1085 and my guess is that that would well and truly contain this market based on the last few day's action.

Maybe we see the support pivots coming into play... maybe. First support at 1003. Anyway, they're my points of reference to watch out for.

The 20dma of the equity only put/call ratio is still dragging it's ass along the lowest levels of the last 3 years and that still says to me that the market is toppy.


But those low readings can and do drag on.

VIX is the interesting one having hit 30 on Friday. VIX gave a pretty reliable short term buy signal that manifested itself on Thursday of last week, but that all turned to crap on the Friday. The VIX is about 50% higher than current realized vols (on a 20 or 30 day lookback basis); I don't know whether that means options are a sell, because realized vols could just pick up a canter from here... perhaps even gallop off into the sunset.

All in all a pretty interesting week and month ahead. No soothsaying from me at this point apart for not expecting new yearly highs in the month of November... but I don't really think the market is ready to sell of in a major way just yet.

Discuss this and other topics at International Stock Forums. Help our new forum grow with your input.

29 October 2009

High Stakes VIX Bet


The story of the day from the options trader's perspective is not the crimson red condition of the stock indexes, it is the VIX pumpage into extremely oversold levels as detailed by Bill Luby.

Adding poignancy to the situation I have been lured into a wager with Mark over at Option 911. The bet is that VIX will hit 30 before it hits 17. Convinced I would have my ass handed to me, I obtained very favourable odds; the payout, something moderately embarrassing if I lose compared to something really really REALLY embarrassing if Mark loses.

Right now, I'm feeling quietly and unexpectedly confident. :)))

N.B. - Neither Mark nor I are likely to be fooled by the randomness of such a wager, just a bit of frivolity folks.


21 October 2009

The New VIX Reality

An excellent post over at VIX And More about anchoring and expectations etc, anyway, Bill talks about the new VIX reality at it tanks towards 20%.

Previously, I've spoken about using technical analysis on the VIX, so long as it is only about creating boundaries of prove and disproof. Well, a solid break below what seemed to be a base of around 23% certainly disproved the 23% base hypothesis.

The new one is to expect declining average VIX levels. Despite every bit of negativity in the real economy - green shoots or not - stocks just want to grind upwards.

Some are prompted to predict a multiyear bull on that basis... whatever. But right now, folks are comfortable with buying stocks.

Selecting Condor Strikes - A Study

As I have outlined in another thread, people who trade iron condors are usually taught to select short strikes at one standard deviation from the current price action.

As I am developing a conversation elsewhere, I think extrapolating option volatility to "monthized" levels is not optimal.

What I want to do in this thread is select hypothetical strike levels, assuming that an iron condor is put on on the expiry Friday of the previous cycle. Some people like to initiate ICs with 2 months to expiry, so we'll have a look at that too.

I'll be using historic volatility, just so it can be automated.

I'll report on how these strikes are threatened or not as time goes by, to test how well this selection process works.

Note that this does not represent any trades I may be doing, it is just an exercise.

On the chart the red lines are 1 standard deviation (68% theoretical probability of staying inside).

The Blue lines are 1.28 SDs (68% theoretical probability of staying inside), which you would probably never get enough premium to trade.

The Green lines are at 0.6 SDs and represent what a low probabilty condor trader might select. It is presumed this trader is prepared to adjust more aggressively.

The top chart with heavier dotted lines is to represent a trade initiated 16 Oct with Nov expiry. (1 Month)

The 2nd chart with lighter dashed lines is to represent a trade initiated 17 Sept with Nov expiry. (2 months)

The 3rd chart lighter dashed lines is to represent a trade initiated 15 Oct with Dec expiry. (2 months)

I have also posted this at http://www.internationalstockforums.com/index.php/topic,29.msg64.html#msg64 That will be an easier place to follow allong as time goes by. Comments most welcome there.

Click to expand image.

19 October 2009

S&P500 Soothguessing

(Also posted at International Stock Forums.)

As we head into the new week, once again I pull out my crystal ball (which I'm thinking of sending back for a refund) and look for signs of a top in this market. Ahhhh life is so tough for bearish prognosticators. Once again I'm going to have a look at those leading indicators than markets are so adept at ignoring.

Firstly, VIX. As I said in a previous post, I have no challenge with technical analysis on the VIX, so long as it is about creating boundaries of proof and disproof. My thesis was that VIX had bottomed for now at ~23%. This has now been disproved with Friday's close at around 21.4%. VIX watchers are postulating that it is now oversold on whatever their favourite basis is for such opinions. I'm inclined to agree.


Even if we get a mean reverting bounce in the VIX via a retracement in the Spooz, you'd have to think there is generally lower levels in the VIX's cards as the market grinds upwards.

My old favourite, the 20dma of the put/call ratio is still dragging its ass along some of the lowest levels of the past three years. Clicking down a couple of gears to the 5dma of the put/cat ratio and we are at new lows as of Friday's close.


Nobody wants to hedge their portfolio any more.

This gives us a picture of complacency and this is generally regarded as a contrarian signal. It should be noted however, that complacency can last for some time.

The case for resistance can be made by the monthly pivots. These have shown areas of interest in the past few months and as we are at R1, I'm looking for some genuine signs of resistance. We've had a bit of a pause there during the latter part of last week, but I've yet to be convinced we don't grind higher. Markets have opened up a tick or two as I write, so waiting to see definitive signs of direction for this week.


Good luck


14 October 2009

Gold Volatility 14 Oct '09

Gold volatility went into the tank today and with gold not far off those all time highs one has to wonder why. Below is the Chart of GLD with CBOE's $GVZ (The gold VIX).


The $GVZ plonked to 20 and a bit and while that is still a fair way above 30 day historical volatility at 16%, it represents a fall to close to the "normal" premium of IV over HV in gold options.

You'd have to suspect at least a pause/retracement from here if that means anything at all. Perhaps the talk is some quarters of a bottom in the dollar is easing concerns, though the dollar is still taking it where it hurts.

Countering that is the seasonal tendency in gold which resumes an upward bias right up to Christmas (depending whose dodgy data you use).

I'm still bullish after some sort of pull back. Markets just want to go up right now, but option traders seem skeptical.

08 October 2009

Gold Volatility 8 Oct '09

OK, so I have a thing about Gold at the moment. There is nothing unusual about that as half the universe has a thing about it at the moment. With gold grinding out new all time highs every day, there is nothing to be surprised about.

For me it is more about finding option opportunities, hence the prelection with gold option IVs.

I had an idea that with new highs in the underlying, we'd see new highs in implied vols as punters bought calls with their ears pinned back. This is not how it's playing out at this stage. This IV peak is lower than the IV peak in early September, even though the "actual" volatility of this move is slightly greater than the early September one. So, what this tell us?

Probably nothing.

But if any delusions can be derived from this, it is that option traders are toning down their expectations of more upside in gold. It should be noted that implied is still miles higher than realized with 20 day HV at about 17.5%, but this seem to be a chronic situation. IVs have consistently been higher than realized for quite some time.

The standard wisdom says that either IV drops or realized increases. It ain't necessarily so with gold.

No ideas for a trade *right now* but a few ideas depending on how things pan out

07 October 2009

Gold Volatility Popping Again


As we all know gold is breaching all time highs right now and leading on from my post yesterday http://www.internationalstockforums.com/index.php/topic,4.0.html there is some interesting developments from an option trader's point of view in that implied volatility (vis a vis option premium) is spiking well above current realized volatility.
Here is the last three months of volatility history on GLD (Gold SPDR)

As is obvious, implied volatilities are well over the odds. As you would expect, most of the meat is in the higher strikes as shown by this skew graph:


This means call option buyers, particularly OTM call option buyers need further dramatic rises to turn a profit, whereas on the face of it, writers would have an edge here. That's on the face of it. Who you be game to write call options here? Not this little black duck; not yet. I've got some naked put shorts I wrote at the end of august in anticipation of the seasonal gold bull, plus trading the moves with various strategies, but would I write more puts here?

Well I prefer to write puts at potential pivot point lows and that ain't here. (With the caveat that it has to make statistical sense to do so)

This situation is still developing from my point of view and worth watching for a nice writing opportunity. The $64,000 question is whether realized volatility catches up with implied, or whether gold bugs are just having another "Gold to $5,000 oz" party, are wrong again and IVs collapse back to current reality. We would need some very strong moves, relatively, to justify this IV.

Stay tuned.

28 September 2009

Coughing Up For Gold Options

The recurring theme in stock index options over the last few months has been the chronic overvaluation as measured by implied volatility over the eventual realized volatility. Theoretically, this has been an excellent time for index option writers, except that the indexes have been running a long way from their mean. Any sellers writing fairly close to the money (like moi :-0) have been as busy as a one armed taxi driver with crabs, making adjustments.

We've had to work pretty hard for our money.

Index options haven't been the only ones in more or less chronic overvaluation. Gold options have been in a similar situation. I like the futures and their options, but the gold ETF, GLD and its options pretty much mirror the futs.

Check out the IV/HV chart for the last six months.

Even ignoring the IV spike earlier this month, those buying options have been paying well over the odds. Writing options here seems the no brainer. I liked the idea of selling premium with some long delta with a couple of different ideas leading into September, due to the pretty reliable seasonal tendency. That's worked out pretty well, but who's game to write unhedged on the call side in this market?

Not this little black duck!

Runaway gold markets don't happen that often, but the bulls can go berserk if *something* happens. Nevertheless, there is a bit of short gamma fun to be had here in this market... just cap the risk IMO.


21 September 2009

Bloomberg Option Blooper

There are no end of erroneous statements regarding options that appear in financial publications. Today I'm going to pick on an article in Bloomberg, because I just happened to do something I don't often do... and that is read Bloomberg. (Nothing worse about Bloomberg than other Wall Street Cheerleaders, I don't often read much of any of them).


Oil Options Hit Highs as Verleger Predicts 44% Plunge

Sept. 21 (Bloomberg) -- Oil traders are paying more than ever in the options market to protect against a plunge in crude prices.

Oil options are something I follow pretty closely, so fearing a volatility spike that I had missed, I immediately pulled up $OVX (The VIX of oil options)


Hmmmmm IV near recent lows, no spike there. What could our B'berg author be on about here. Reading further:

The gap between prices of options betting on a decline and those that would profit from a rise in oil widened to a record 10 percentage points, according to five years of data compiled by Banc of America Securities-Merrill Lynch...
...Options granting the right to sell, or put, oil in December below current prices have a so-called implied volatility of 54.3 percent, compared with 43.3 percent for the equivalent options to buy, or call, data from the New York Mercantile Exchange show.

What's this? The arbitrage opportunity of the century? As I pulled up the option chain for December crude, I was multitasking and transferring every cent of spare cash in my trading account for mountains of reversal margin. Alas, I was disappointed as both ATM calls and puts were priced equally in terms of volatility.

What the f*** were they on about?

The subtle clue is what I have retrospectively bolded in the above quote. The author was comparing the IV of WOTM puts to WOTM calls. This is nothing more than a downside price skew. Skew is common in all sorts of markets; in fact it would be a little unusual for a market not to have some degree of skew to one side or another.

It's true that event sensitive commodities usually have skew to the upside and therefore skew to the downside in oil is noteworthy. The hypothesis that oil probably will experience some downside pressure is a fair one. But I wish they would call a spade a spade rather than dishing out erroneous bullshit on on options like this article has. Options are confusing enough for the neophyte, without inaccuracies from supposedly authoritative sources.

Give yourself an uppercut Bloomberg.

12 August 2009

Gold Doldrums

A few days ago I highlighted the rising implied volatility of gold options. That seems to have been the high for gold IV for now, as IVs have settled back to the high teens.

Nothing more than a short term IV spike which has been fairly typical.


Meanwhile, realized volatility remains low, much lower than IV but as discussed before, there are good reasons for this.

Gold seems to be rooted in the doldrums, but there is always that September seasonal tendency to look out for and then there is the inflation hedge argument... QE and all that.

My purely baseless guess is that gold dribbles along for a while; until it doesn't.

07 August 2009

Volatility? What Volatility?

In option land, volatility has a specific mathematical definition and is used in the various pricing models (Black Scholes et al). That definition is as follows - the annualized standard deviation of logarithmic daily change in price. I have highlighted "daily" because that's what it measures, the daily change of price.

Option volatility takes no account of the trendiness of the underlying instrument however.

Let say instrument (a) moves 1% up and 1% down alternately for 20 days in a row, but instrument (b) moves up 0.5% every day for twenty days. Instrument (a) finishes very close to where it started, hardly any nett movement at all, yet (b) is up over 10% higher after the 20 days.

According to the option volatility formula, the volatility measured over this time frame is much higher for (a) than for (b).

But depending on your precise option positions (b) could probably *feel* a lot more volatile than (a).

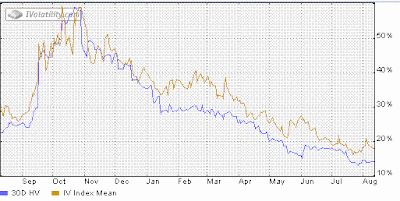
This is the feeling some may be having at the moment if trading delta neutral strategies on index options (or just about any stock option actually). Realized volatilities have been trending down for months, with 20 day historical volatility sitting at just ~16% as I write. Yet anyone with short gamma wing spreads or (gulp) short strangles is going to be *feeling* like they are in a volatile market.

Well actually, we are, if you use a different measure of volatility.

Plain old standard deviation, measures the deviation from the mean (and as used in Bollinger Bands) over a set time frame tells a different story. While it has nothing to do with option pricing, it does show how much price is moving around or a longer period of time.

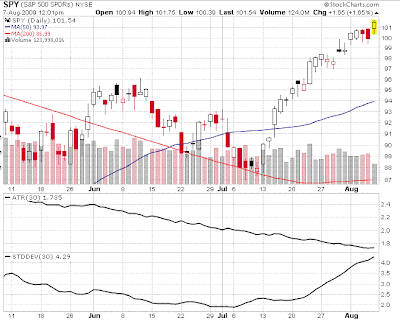
Check out the chart below (NB Stockcharts doesn't have HV as used in option pricing models, but Average True Range is used a proxy, as it also measures the daily range): Over the last three months 30 day ATR has gradually been trending downwards, mimicking HV as use in OPMs, yet 30 day standard deviation is at a high over the time period.


This is telling us what we already know, that the Indices have been flying in one direction. Volatility over a period of time IS in fact high as measured by standard deviation, even though volatility of daily changes has been declining.

It's another dimension to volatility that we retail traders probably need to throw into the mix when making volatility projections. For us, option volatility is important for pricing, but may not tell the whole story when analysing potential trades.

05 August 2009

Gold Volatility Popping

Gold volatilities, along with vols in just about everything have been in a steady tankage since the near Apocalypse in the latter part of 2008.

The following image is of 63 day, 20 day and 6 day historical volatilitities on GLD the gold ETF; the varying lookback periods serve as a look at the structural volatility of gold. The general level of HVs have come from ~50-60% down to sub 20%, effectively reducing by two thirds. It does look like HVs are bottoming out however.

This level of HV is not unusual, having visited these levels twice before since the inception of this ETF in late 2004, the observation at those points was that vols stayed pretty low for months before eventually popping.


So does this mean gold stays quiet for a few months? Maybe not. Two things to note going forward.

1/ The seasonal tendency of gold shows that September is traditionally when gold starts flying, because of jewellery demand at this time of year,apparantly. This chart from www.spectrumcommodities.com


Important thing about seasonals; it's a historical *tendency*. It doesn't mean gold WILL run higher during September.

2/ Implied volatilities are popping, with IV a full ~50% higher than the 30 day HV plotted on the following graph.


So are option traders anticipating an increase in realized volatility? Well, IVs have consistently overestimated realized volatility; there's good reason for this with the ever present chance of Gold bugs going ape shit over one or another threat to world stability.

But an IV pop is what it is, it doesn't necessarily protend anything, as we can see from recent history, but reason to sit up and take notice. Perhaps the pop in the underlying a couple of days ago is responsible, perhaps gold bugs are about to party... again.

I think it's interesting juncture. I don't have a position in gold at the moment, but this looks an interesting time to watch more closely.

02 July 2007

A Look At Metals Volatilities

Implied volatilities in the metals I trade (gold, silver & copper) are at the moment, at somewhat of a low. If we go by the traditional option dogma of buying options when vols are low, then on face value, metals options are a buy.

But are they. In my experience, it is not as straight forward as that. Well if you have a clear directional view of an imminent move, then sure, buy a call or a put, or the directional spread of your choice.

The first thing about low volatilities, is that they can stay low for a LONG time, or even go lower. This is generally not a good thing if you are long options. An option trade is also a volatility bet to a greater or lesser degree, depending on the strategy. When we buy options, we are long "vega" which means we preferably want volatility to increase, or at least we want the underlying to start trending. If not, we get chopped to pieces by theta (time decay). If volatility decreases, we lose again.

Lets have a look at the volatility picture of Gold (Copper is quite similar):

IVs are basically a third of what they were a year ago and as yo can see they have been even lower. If the unceasingly bullish Gold Bugs are correct, gold will skyrocket as this credit bubble unravels. Not only will gold fly, but gold IVs will also go berserk. Equally though, I have read credible articles that say go will go the same way as housing, into the pits. Who knows?

The big question is if gold makes a big move, when will it be? Well I have no freakin' idea, but let me show you Silver IVs over th last 2 years:

A similar picture to gold, but with an interesting lift in IV on the back of last weeks dumpage.

Whether this means anything or represents an opportunity, I am pleading the 5th, but I say it's interesting enough for a post on my blog and something to definitely follow.

Stay tuned.

14 December 2006

VIXatious VIX

Adam from the Daily Options Report was alert when he spotted some overbought VIX last week and has noted the now oversold condition here, and therefore possibly short term bearish.

This was also not lost on the folks at Trade King, nor the "sages" at Bloomberg who think it bearish as well.

The Chicago Board Options Exchange SPX Volatility Index yesterday closed below 10 for the first time since 1994, signaling that fund managers are too confident stocks will rise.

Low volatility ``suggests that investors are getting a bit too complacent,'' said Ian Sharman, who helps oversee $1.2 billion at Royal London Asset Management and owns U.S. stocks. ``The market is climbing a wall of worry.''

The VIX is based on prices paid for Standard & Poor's 500 Index options. In the past, lows in the VIX have heralded stock- market declines. There were sell-offs in May of this year, in 2001, in 1998 and in 1997 around the time that the volatility measure reached lows for the year. ===>>MORE<<===

I note the cautious to downright hedged tone to these calls (rightly so) because it is not as reliable a signal as very high VIX.

Along the same vein, when *everybody is thinking the same way, it's often a good time to fade.

I hope not, I'm positioned for sideways to more upside in most positions.