Showing posts with label Index Options. Show all posts

02 November 2009

November Soothsaying... Or Not.

As October trading is over it's time to look forward to the next month with reference to our new monthly pivots now set in stone, with the last trading day in October adding a fair bit of interest to the equation.

The monthly pivots have been very influential on the resistance side of the equation, but with scarcely any relevance at all on the support side. This is fairly expected in a stong uptrend.

click to enlarge


First line of resistance is 1085 and my guess is that that would well and truly contain this market based on the last few day's action.

Maybe we see the support pivots coming into play... maybe. First support at 1003. Anyway, they're my points of reference to watch out for.

The 20dma of the equity only put/call ratio is still dragging it's ass along the lowest levels of the last 3 years and that still says to me that the market is toppy.


But those low readings can and do drag on.

VIX is the interesting one having hit 30 on Friday. VIX gave a pretty reliable short term buy signal that manifested itself on Thursday of last week, but that all turned to crap on the Friday. The VIX is about 50% higher than current realized vols (on a 20 or 30 day lookback basis); I don't know whether that means options are a sell, because realized vols could just pick up a canter from here... perhaps even gallop off into the sunset.

All in all a pretty interesting week and month ahead. No soothsaying from me at this point apart for not expecting new yearly highs in the month of November... but I don't really think the market is ready to sell of in a major way just yet.

Discuss this and other topics at International Stock Forums. Help our new forum grow with your input.

19 October 2009

S&P500 Soothguessing

(Also posted at International Stock Forums.)

As we head into the new week, once again I pull out my crystal ball (which I'm thinking of sending back for a refund) and look for signs of a top in this market. Ahhhh life is so tough for bearish prognosticators. Once again I'm going to have a look at those leading indicators than markets are so adept at ignoring.

Firstly, VIX. As I said in a previous post, I have no challenge with technical analysis on the VIX, so long as it is about creating boundaries of proof and disproof. My thesis was that VIX had bottomed for now at ~23%. This has now been disproved with Friday's close at around 21.4%. VIX watchers are postulating that it is now oversold on whatever their favourite basis is for such opinions. I'm inclined to agree.


Even if we get a mean reverting bounce in the VIX via a retracement in the Spooz, you'd have to think there is generally lower levels in the VIX's cards as the market grinds upwards.

My old favourite, the 20dma of the put/call ratio is still dragging its ass along some of the lowest levels of the past three years. Clicking down a couple of gears to the 5dma of the put/cat ratio and we are at new lows as of Friday's close.


Nobody wants to hedge their portfolio any more.

This gives us a picture of complacency and this is generally regarded as a contrarian signal. It should be noted however, that complacency can last for some time.

The case for resistance can be made by the monthly pivots. These have shown areas of interest in the past few months and as we are at R1, I'm looking for some genuine signs of resistance. We've had a bit of a pause there during the latter part of last week, but I've yet to be convinced we don't grind higher. Markets have opened up a tick or two as I write, so waiting to see definitive signs of direction for this week.


Good luck


14 October 2009

The Intel Torpedo

The bulls will be feeling all warm and fuzzy this morning as it looks as though Intel earnings will be giving the Spoooz a leg up over resistance and to a new high for the year, if the futures right now are any guide.

Of course it means my double top scenario has taken a torpedo to the magazine case... a direct hit. Never mind, I'll keep my guru robes in the bottom drawer just in case I get a market call right one day. I should have just taken the Abbey Joseph Cohen line and basked in my correctness.

This also means the VIX will sink below the 23% water line, in fact has already closed below yesterday.

Man the lifeboats and board the good ship PollyAnna LOL. I give up, I'm turning bullish.

(Which could just be a great sell signal).

However, worry not for my finances. Realizing how crap I am at market calls, I continue to be delta neutral on the indexes. All this stuff is for amusement only.

I love options :).

12 October 2009

(VI)X Marks the Top?

So the S&P500 just about touches the high of the year from last month and slowly backs away. At this point I'm not going to remind you of my top call from September 30, just in case it blows straight through to new highs and trashes my reputation as market soothsayer and guru. LOL

The point of focus for me is now VIX. The finer points are expertly covered by Adam Warner and Bill Luby (and others), but I'm looking at the 23% level and wondering whether that is the base level for right now.


Which begs the question. Is the VIX predictive or reactive... or both. I lean on the side of reactive, but the mean reverting characteristics are well known, hence indicating as least some predictive implications.

The next question is "can technical analysis be used on the VIX?"

I say why not?

I say you can, so long as you're not trying to make predictive assumptions with pretty coloured lines and purely mathematical constructs. To me TA is about create boundaries of proof and disproof. This fits in with VIX analysis for me.

IOW a break below 23% disproves my basing hypothesis. A bounce above supports it.

Adam and a few others use the "10% above or below the 10dma" method to spot potential points of over/undersoldedness (to invent a new word). I'm far too lazy for that so I've tacked a 3,10,16 MACD on the bottom to essentially arrive at similar conclusions. It works adequately for that purpose.

Do we see an oversold VIX? Yes. Does it mean anything? Who the hell knows. But there is that divergence on the bog standard MACD.

The upshot is that I'm trying to convince myself of the chance of a double top right here.

Yes, I'm fighting for my guru call's survival...

...somehow I fear it may be in vain. This market just wants to go up.

09 October 2009

Guru S&P500 Prognostications

In the absence of anything notable to report re my current obsession with gold, I'll have a look today at my guru call from Sept 30. (N.B. all the guru stuff is tongue in cheek and a bit of self derogation.) as you will recall I Went Out On A Limb and called a medium term top on the S&P500.

Well the bulls are putting that call under some serious pressure after some smugness inducing down days immediately succeeding my call. As of now, the yearly highs still have not been taken out, so I haven't cancelled my guru robe order just yet. I'm speculating on a double top and that divergence (for whatever that is worth) in the MACD does its freakin' job of psyching traders into a sell-off.

The 20day MA of the put call ratio I keep posting in the hope someone takes notice, is still highlighting extreme complacency.

So I'm sticking to my guns for now. Still no money on the outcome here, just managing a delta neutral trade. That means that don't want be toooooo right, sideways consolidation would be good.


01 October 2009

The Creaking Limb Holds

The sellers have come in to save my call. Phew, my campaign for gurudom is intact. Of course, having an iron condor to manage, I hope I'm not too blinkin' right.

Some consolidation right about here would be nice.


The greater question is the medium term prospects for stocks. We've come a long way and there is a lot of euphoria about, mixed in with some stubbornly pessimistic outlooks.

I'm doubtful that many of the problems which caused the financial cesspit we're in have been resolved in any way, and the real economy is still struggling. So the question is to what extent stocks will start to reflect reality - or some future version of it?

Which begs the whole gamut of existential and related questions. What is reality? What is value? Inflation or Deflation? etc etc etc

More importantly, when will the dip buyers step up to the plate?

30 September 2009

The Limb I Went Out On Is Cracking Already

Amazing market we're in at this time. There is dip buying, then there is dip buying.


Going Out On A Limb

No, I'm not embarking on a mission of McLean-esque spiritual discovery, but I am taking the unusual step of publicly calling a medium term top on stocks.

Actually, I don't give a rats, I'm delta neutral and really would love some sideways consolidation ( a top of sorts I guess). I'm really just about managing whatever this ludicrous market throws at me. I just think that if that rich mental map that we traders think we have is worth a cracker (probably not), this really "feels" like it wants a decent retracement.

The $64,000 question these days is - what constitutes a decent retracement? Dip buyers apparently are cashed up and are all over any divot, never mind actual dips.

Lots of sentiment indicators are screaming "complacency", none more so than that 20dma of the put/call index I keep pulling up in the hope of a guru-like market top call. It's still entrenched at around it's lowest level of at least the past three years.


As mentioned in an earlier post, this is a pretty blunt tool, but usually manages to bludgeon the market into some sort of pullback. Add to this the "October Meme" and I think there is a reasonable case for a little bearishness.

N.B. For amusement value only, there is no money riding on this.

28 September 2009

Coughing Up For Gold Options

The recurring theme in stock index options over the last few months has been the chronic overvaluation as measured by implied volatility over the eventual realized volatility. Theoretically, this has been an excellent time for index option writers, except that the indexes have been running a long way from their mean. Any sellers writing fairly close to the money (like moi :-0) have been as busy as a one armed taxi driver with crabs, making adjustments.

We've had to work pretty hard for our money.

Index options haven't been the only ones in more or less chronic overvaluation. Gold options have been in a similar situation. I like the futures and their options, but the gold ETF, GLD and its options pretty much mirror the futs.

Check out the IV/HV chart for the last six months.

Even ignoring the IV spike earlier this month, those buying options have been paying well over the odds. Writing options here seems the no brainer. I liked the idea of selling premium with some long delta with a couple of different ideas leading into September, due to the pretty reliable seasonal tendency. That's worked out pretty well, but who's game to write unhedged on the call side in this market?

Not this little black duck!

Runaway gold markets don't happen that often, but the bulls can go berserk if *something* happens. Nevertheless, there is a bit of short gamma fun to be had here in this market... just cap the risk IMO.


26 August 2009

PutCall Ratio Divinations

The put/call ratio: Is it it predictive or reactive? Maybe a bit of both, just as I think VIX is. But like VIX and volatility in general, it tends to be mean reverting. Extreme readings don't often last a hell of a long time and are often the harbinger of a reversal - or at least a consolidation or retracement in the prevailing trend.

For the medium term view, and the P/C being a very volatile figure, I like the 20DMA of the equity only put/call ratio to find extreme readings.

Here is the last three years of this figure in green, plotted against the SP500:


A close examination highlights the inverse correlation.

The interesting thing for me is that the 20DMA of the equity only put/call ratio is now at its lowest level in the three years of the plot. That in and of itself probably means zip in the predictive sense, but if one wanted to make a case for a pause/consolidation/retracement in the indices sometime very soon, this indicator certainly would add some weight to that hypothesis.

Lots of bears are talking another major down leg, and generally I'm still a bear too, but I doubt we'll see too much downside in the medium term. But I'm making the case for a short term top somewhere around about here.

Some nice sideways action would do my spirit (and my index position) the world of good.

07 August 2009

Volatility? What Volatility?

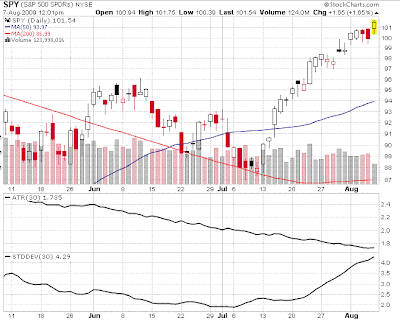
In option land, volatility has a specific mathematical definition and is used in the various pricing models (Black Scholes et al). That definition is as follows - the annualized standard deviation of logarithmic daily change in price. I have highlighted "daily" because that's what it measures, the daily change of price.

Option volatility takes no account of the trendiness of the underlying instrument however.

Let say instrument (a) moves 1% up and 1% down alternately for 20 days in a row, but instrument (b) moves up 0.5% every day for twenty days. Instrument (a) finishes very close to where it started, hardly any nett movement at all, yet (b) is up over 10% higher after the 20 days.

According to the option volatility formula, the volatility measured over this time frame is much higher for (a) than for (b).

But depending on your precise option positions (b) could probably *feel* a lot more volatile than (a).

This is the feeling some may be having at the moment if trading delta neutral strategies on index options (or just about any stock option actually). Realized volatilities have been trending down for months, with 20 day historical volatility sitting at just ~16% as I write. Yet anyone with short gamma wing spreads or (gulp) short strangles is going to be *feeling* like they are in a volatile market.

Well actually, we are, if you use a different measure of volatility.

Plain old standard deviation, measures the deviation from the mean (and as used in Bollinger Bands) over a set time frame tells a different story. While it has nothing to do with option pricing, it does show how much price is moving around or a longer period of time.

Check out the chart below (NB Stockcharts doesn't have HV as used in option pricing models, but Average True Range is used a proxy, as it also measures the daily range): Over the last three months 30 day ATR has gradually been trending downwards, mimicking HV as use in OPMs, yet 30 day standard deviation is at a high over the time period.


This is telling us what we already know, that the Indices have been flying in one direction. Volatility over a period of time IS in fact high as measured by standard deviation, even though volatility of daily changes has been declining.

It's another dimension to volatility that we retail traders probably need to throw into the mix when making volatility projections. For us, option volatility is important for pricing, but may not tell the whole story when analysing potential trades.

25 July 2009

American vs Euro Double Take

As I trawl around the options universe I see many statements from the erroneous to the downright dishonest. Occasionally there are statements from ersatz options "experts" that even make me do a double take, so stunning are they in their cretinous ignorance.

Behold the latest example, from someone selling information, producing videos etc:

American vs. European style options:

American style options such as OEX or SPY can be traded anytime. European style options can not be closed until their expiration date. I prefer to trade American style options since I can buy and sell them out when I want.

LMAO

Of course European style options can be traded into and out of, anytime, just as American style options can. Jesus! We ALL know that one don't we? (For the newbies reading this, American or European style refers to when options can be exercised, not whether they can be closed out or not.)

Further down the page, we are served up this little beauty, in big bold type:

Turn $1000 into $124,000 in One Year!!!

Where do I sign?

02 July 2009

I'm Buying

OK now that I'm in full conspiracy theory mode, my prediction for today is that GS and MS will have a busy day in the SP pits.

A comment in response to Marketwatch's pre-non farm payrolls numbers:

MarketWatch - why do you pass on this gobbledegook? You guys know as well as all of us that the U.S. government "statistics" are about as dependable as a 2 dollar watch.

...and there are dozens along the same lines.

The payroll numbers will be dreadful, but folk will suspect the government is lying and things are actually much worse (Noooo - who'd believe that?). Folks will realise the bobbleheads optimism is totally misplaced and flog all their stocks the market will open sharply down.

GS & MS will start buying with their ears pinned back for some mysterious account, the market will finish green, Goldilocks will make another cameo appearance, folks will be conned into believing all is well and a return to the upward grind will ensue.

Disclaimer: I'm short gamma on the indices with a little upside skew.

OK I've let my cynicism out for a run, back to normal programming shortly.

Update: As expected, the #s were woeful, now all I need for soothsayer status is for the SP500 to be green by day's end.

22 June 2009

Of Tribes And Markets

Many centuries ago, a great chief took his son on a journey across the great plain, over two great rivers, across the desert, through the forest whereupon he found a high place. He told his son to look as far as his eye could see and said:

Son, we are Carvetii, this is Carvetii country, and forever more the tribe was known as the Carvetii.

At about the same time another great chief took his son on a journey through a great forest, across two deserts, over a river and to the highest point for 100 miles. He told his son to look as far as his eye could see and said:

Son, we are Cantiaci, this is Cantiaci country, and forever more the tribe was known as the Cantiaci. (These are ancient Briton tribes in case you were wondering.)

Yet another great chief took his son on a great journey at the same time so many centuries ago. He led his son across three plains, across 14 deserts, paddled over 5 lakes, traversed 7 mountain ranges, through 3 forests, across another three deserts, another 2 rivers until he found a high place. He looked at his son and said:

Son, where the Fukawee, and forever more, that people were known as Fukawees.

Centuries later, I am wondering the same thing following the markets convolutions. VIX seems to be moribund, yet is higher than at most times before Sept 2008. Bubblevision boasts of green shoots and recessions ending, yet real world data still indicates death by a thousand cuts. Housing industry vested interests speak of a bottom, yet housing remains very expensive by any sensible vectors of value (here in the UK at least).

Worst of all, brokers shout BARGAIN BUY STOCKS from proverbial rooftops, yet reported earnings make them look expensive.

There is no doubt that the cash raining down in torrents from magical helicopters is having an effect; but where next?

The SP500 is rolling over and getting a bit of a shellacking today in particular. A simple profit taking retracement, or an end to a dead cat bounce? Will Armageddon part 2 start up after this intermission, or is it the next great bull run.


Look, all I want is to put on a nice delta neutral strategy with a nice wide profit zone and go and watch the tennis, supping Champagne, slurping strawberries and cream and watch Andy Murray disappoint the Brits again, as is the tradition. Alas, this market is making me nervous. I have no fear of adjusting, but being full of booze and around the corner at Wimbledon stadium, my mind wandering to fantasy as I watch the ladies play... or not, as the case may be, is just not conducive to high falutin option trading.

So I guess I'll stay home and watch it on TV...I can't get out of my driveway anyway now that The Championships have started anyway. It will have to be pizza and beer, rather than champagne, strawberries and cream.

03 January 2007

Counting My Chickens

Those of us who like to try and trade normal wave structure (whatever that is) must be feeling as if said wave structure had been cancelled indefinately... at least as far as the stock indicies are concerned.

We've all stared disbelievingly at the SP500 for several months now so no need for me to post a chart, but just in case you've been visiting Venus or somewhere over the last months, it's gone pretty much straight up without a breather.

I like to write premium over the indicies in the form of strangles/condors and suchlike and leg into them off what I think may be swing points. More recently, because of the pathetic volatility and relentless boomage, I've tried to have a mixed gamma position in the form of put backspreads written at a credit (My thinking was to position for a correction but still profit if it just kept going up). This has worked pretty well, if not unspectacularly, but at some stage I want to get back to short gamma again...

...and I've done that this expiry. So far the momentum in the SP looks to be slowly abating and looking a tad toppy, to me at least. This first trading day had me thinking I'd have to defend the short calls... then.... a selloff! OMG!

Could this be the start of a long overdue correction? (in the normal wave structure style?). The Dow is still green as I'm typing this but the other indicies are red after being up quite strongly.

I might be counting my chickens, but I think the top is in for this expiry. It will make a nice start for this year if this short gamma position goes out with a whimper.

My $0.02