OK what's this dumpage all about? The excuses proffered so far:
*Sub-Prime Contagion
*Removal of uptick rule for shorts
*Yen carry trade unwind
*Funds cashing out to build a war chest.
Let's look at these one at a time.
*Sub-Prime Contagion - Well Duh!!! All the Wally's who said it was all contained should be tied up to posts and their tongues cut out. Of course it was going to take out the rest of the economy... 'nuf said?
*Removal of uptick rule for shorts - Absolute BS! Institutions have been able to do it (shortsell without an uptick) via derivative proxies forever. It's only the small fry like us that can now do this now... and we have always been able to do it with futures... erroneous at best.
*Yen carry trade unwind - Empirically, this is not only back on the agenda, but looks to serious. While the Dollar has been in a strong retrace against Euro, Pound, AUD etc, it is getting absolutely poleaxed by the Yen. The carry trade is unwinding and unwinding fast.
*Funds cashing out to build a war chest. - According to at least one money manager, the evidence is in the oilers being crunched in the face of rising crude. Conclusion - the funds want CASH.
... and look at treasuries. There is mountains of cash going there in the face of a crising interest rate environment as safe haven. Expect some volatility there!
IMO, This is the beginning of the credit bubble apocalypse. The $417 is finally hitting the fan. This is not to say we go straight down from here, but we should be aware of that possibility... and at least expect massive VOLATILITY.
Cheers... be careful folks.
__________________
27 July 2007


17 July 2007
CDOs and Toxic Debt
From Australian TV ABC Lateline program. Economics reporter Stephen Long talks about the US sub-prime mortgage market , Collateralized Debt Obligations (CDOs) and the collapse of two Bear Stears hedge funds, and the potential for this to set off a global credit crash.
Quote: "The day of reckoning is nigh"
Quote: "The day of reckoning is nigh"
10 July 2007
Bond Apocalypse Averted - For Now
Well my picture perfect 10yr t-note trade with all its bearish connotations has been scuppered over the last to sessions by none other than, err... the bears.


NEW YORK, July 10 (Reuters) - U.S. Treasuries rallied on Tuesday as investors poured out of stocks and speculative bonds for the relative safety of U.S. government securities.
The drive to Treasuries was fed by mounting concern over subprime mortgage debt and the deteriorating housing market that could also hurt U.S stocks, analysts and trader said.
Earnings warnings from retailers and home builders and also credit rating agency Standard & Poor's statement that it may cut ratings of some subprime loans and is reviewing its ratings of collateralized debt obligations were all factors hurting equities and nongovernment bonds.
"It has to do with the S&P headline on subprime. Credit spreads are blowing out. The fear is that they will force selling by those investors who can't hold on to these low investment-grade bonds," said Carl Lantz, U.S. interest rate strategist at Credit Suisse in New York. >>MORE<<
Interestingly, the technically sloppy short setup on the EuroBund has turned up a better looking long trade from a nice double bottom. A long case good certainly be made for the US contract as well, perhaps more so... but I was short. :-P

What has actually happened is that my bond apocalypse has turned into a USD apocalypse, with basically the same reasons quoted; sub-prime/housing slowdown blah blah. This has caused quite some technical damage to the USD index with new lows printed.

For the bulls it really is head in the sand time (if they want to stay bulls). In my humble and ill-educated opinion, the anglo economies are fucked, and are living on borrowed time (and whacking great piles of borrowed money). It will just take a bit of time for muppets to realize this fact.
The precise route by which this financial apocalypse plays out though, is anyones guess.
07 July 2007
Weekend update on Treasuries
Just a quick chart update on my latest obsession in the treasury markets. The short trade setup triggered nicely and has continued in the desired direction. The 10 year T-Notes that I trade are now roughly at the first point of possible (and tenuous IMO) support and not really showing any signs of stopping at this stage.
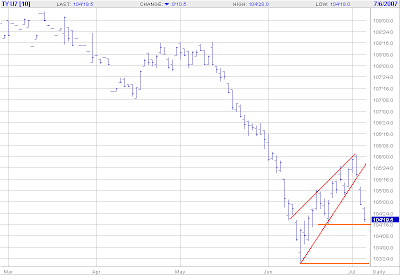
The other contract I follow is the EUREX Euro Bund. Although the setup wasn't as technically crisp as the t-notes, it was still a valid short setup that triggered a bit earlier while the yanks were messing around and tyeing firecrackers to their neighbor's cat's tail and other pyrotechnical frivolities.
The bund is actually now testing contract lows, a point interest rate obsessed equity investors deem to have missed at this point... or are ignoring.

... or maybe they are expecting support.

The other contract I follow is the EUREX Euro Bund. Although the setup wasn't as technically crisp as the t-notes, it was still a valid short setup that triggered a bit earlier while the yanks were messing around and tyeing firecrackers to their neighbor's cat's tail and other pyrotechnical frivolities.
The bund is actually now testing contract lows, a point interest rate obsessed equity investors deem to have missed at this point... or are ignoring.

... or maybe they are expecting support.
05 July 2007
Next Leg Down For Treasuries?
Earlier in the week I highlighted a setup in 10 year t-notes. Aggressive traders may have taken a short trade straight of that setup, others may wait for a confirmation of price breaking below the trendline. Those waiting got their trigger today.

However there was clue that this would definitely break down in the price action of the Eurobund, which put in a nasty down day on tuesday and has continues down since.
Now things get very interesting, and not just for bonds. Equities are not likely to react well to lower bond prices and the US indices are off a few points as a result.
Technically, there are some obvious points of possible support, but below Junes low folks will likely start shitting themselves. As several commentators have pointed out recently, the market is starting to do what the Fed refuses to do... and should do.
Elswhere, the Brit have jacked rates up another quarter (but should have gone .5), and the Eurozone is announcing later today.

However there was clue that this would definitely break down in the price action of the Eurobund, which put in a nasty down day on tuesday and has continues down since.
Now things get very interesting, and not just for bonds. Equities are not likely to react well to lower bond prices and the US indices are off a few points as a result.
Technically, there are some obvious points of possible support, but below Junes low folks will likely start shitting themselves. As several commentators have pointed out recently, the market is starting to do what the Fed refuses to do... and should do.
Elswhere, the Brit have jacked rates up another quarter (but should have gone .5), and the Eurozone is announcing later today.
04 July 2007
Peter Schiff verses Everyone
Peter Schiff on Kudlow and Company
And the winner is... well that depends on your cognitive biases.
Always entertaining.
And the winner is... well that depends on your cognitive biases.
Always entertaining.
03 July 2007
10 Yr T-Notes Setting Up
In the early part of June, US treasuries were responsible for some extreme consternation in the equities market due to to their rabid decent into the nether regions of recent price history. (Inverse relationship to interest rates. Bonds down = interest rates up, for those who don't know). From the highs in June at ~108½ on the September 1o year T-note contract, prices plunged all the way to under 104 in a month.
This really caught the attention of an interest rate obsessed equities market. Although the chart doesn't really show it, it put the wind up those who are awake to the risks.
The recent retracement of that move has meant that folks have lapsed back into their easy credit induced trance. However at this point there is an interesting technical setup shown here on the above mentioned contract.

The retracement has taken us to 50% of that move, which followers of Fibonacci and Gann swear is significant. For me, enough follow this theory to make me sit up and take notice, particularly a setup as clean as this.
Aggressive traders might already have gone short already; others may be looking for some confirmation in the price dropping through the support line. I'll be interested in what else happens if the bond dumpage continues.
It could get very interesting.
This really caught the attention of an interest rate obsessed equities market. Although the chart doesn't really show it, it put the wind up those who are awake to the risks.
The recent retracement of that move has meant that folks have lapsed back into their easy credit induced trance. However at this point there is an interesting technical setup shown here on the above mentioned contract.

The retracement has taken us to 50% of that move, which followers of Fibonacci and Gann swear is significant. For me, enough follow this theory to make me sit up and take notice, particularly a setup as clean as this.
Aggressive traders might already have gone short already; others may be looking for some confirmation in the price dropping through the support line. I'll be interested in what else happens if the bond dumpage continues.
It could get very interesting.
02 July 2007
A Look At Metals Volatilities
Implied volatilities in the metals I trade (gold, silver & copper) are at the moment, at somewhat of a low. If we go by the traditional option dogma of buying options when vols are low, then on face value, metals options are a buy.
But are they. In my experience, it is not as straight forward as that. Well if you have a clear directional view of an imminent move, then sure, buy a call or a put, or the directional spread of your choice.
The first thing about low volatilities, is that they can stay low for a LONG time, or even go lower. This is generally not a good thing if you are long options. An option trade is also a volatility bet to a greater or lesser degree, depending on the strategy. When we buy options, we are long "vega" which means we preferably want volatility to increase, or at least we want the underlying to start trending. If not, we get chopped to pieces by theta (time decay). If volatility decreases, we lose again.
Lets have a look at the volatility picture of Gold (Copper is quite similar):
 IVs are basically a third of what they were a year ago and as yo can see they have been even lower. If the unceasingly bullish Gold Bugs are correct, gold will skyrocket as this credit bubble unravels. Not only will gold fly, but gold IVs will also go berserk. Equally though, I have read credible articles that say go will go the same way as housing, into the pits. Who knows?
The big question is if gold makes a big move, when will it be? Well I have no freakin' idea, but let me show you Silver IVs over th last 2 years:
 A similar picture to gold, but with an interesting lift in IV on the back of last weeks dumpage.
Whether this means anything or represents an opportunity, I am pleading the 5th, but I say it's interesting enough for a post on my blog and something to definitely follow.
Stay tuned.
But are they. In my experience, it is not as straight forward as that. Well if you have a clear directional view of an imminent move, then sure, buy a call or a put, or the directional spread of your choice.
The first thing about low volatilities, is that they can stay low for a LONG time, or even go lower. This is generally not a good thing if you are long options. An option trade is also a volatility bet to a greater or lesser degree, depending on the strategy. When we buy options, we are long "vega" which means we preferably want volatility to increase, or at least we want the underlying to start trending. If not, we get chopped to pieces by theta (time decay). If volatility decreases, we lose again.
Lets have a look at the volatility picture of Gold (Copper is quite similar):
 IVs are basically a third of what they were a year ago and as yo can see they have been even lower. If the unceasingly bullish Gold Bugs are correct, gold will skyrocket as this credit bubble unravels. Not only will gold fly, but gold IVs will also go berserk. Equally though, I have read credible articles that say go will go the same way as housing, into the pits. Who knows?
The big question is if gold makes a big move, when will it be? Well I have no freakin' idea, but let me show you Silver IVs over th last 2 years:
 A similar picture to gold, but with an interesting lift in IV on the back of last weeks dumpage.
Whether this means anything or represents an opportunity, I am pleading the 5th, but I say it's interesting enough for a post on my blog and something to definitely follow.
Stay tuned.
29 June 2007
Soybeans, Cotton...Big Day
News this morning in the grain markets revealed that the number of acres that have been planted with soybeans is seriously deficient. This is bullish news for traders in the bean complex with Soybeans going limit up early in the session... thats 50 points!
Those that positioned themselves long in this weeks consolidation at around the 840 cents level will quite naturally be ecstatic with the November contract closing the day at 883.5 cents.
Wheat and corn joined in the volatility but with big moves DOWN.
Cotton also gapped up on similar news of lower acerages.
Farmers trying to cash in on the demand for corn is where those soybean and cotton acreages have gone to, so it is reasoned that there may be an excess of corn come harvest time.
Those that positioned themselves long in this weeks consolidation at around the 840 cents level will quite naturally be ecstatic with the November contract closing the day at 883.5 cents.
Wheat and corn joined in the volatility but with big moves DOWN.
Cotton also gapped up on similar news of lower acerages.
Farmers trying to cash in on the demand for corn is where those soybean and cotton acreages have gone to, so it is reasoned that there may be an excess of corn come harvest time.
Charting Support & Resistance on Futures... Hmmmmm
Charting support and resistance on commodity futures charts can be a bit tricky. The futures price will be the cash price of the commodity plus carrying costs, so deferred contracts can be higher priced than the nearest contract as the physical commodity may have to be held in storage longer. This is referred to as contango.
However, some factors may make the deferred contracts price less than the nearer contracts. This may be lack of immediate demand for deferred delivery, new crop verses old crop supply, as a couple of quick examples.
This has ramifications when looking at charts over the longer term. When looking at a chart of a single contract where cost of carry has been priced in that cost will naturally decay as time goes by, similar to, but nowhere near the extent, of an options contract. This also affects the continuous chart. When one contract expires the next contract is simply tacked on to the continuous chart. The expiring contract's cost of carry will have decayed away to zero, while the new contract being added will have carrying costs reflecting the time till expiry.
Consider the two charts below. The first is The August 2007 contract and the second is the continuous contract.


Notice the difference between the two charts. The August contract shows the recent $70 resistance as have just been broken, yet the continuous shows resistance at a lower level. It also shows some other differences shown by the lower red line in each chart.
This is a profound difference for those used to charting share prices where such factor do not exist.
My approach is to chart short term support and resistance on the individual contract, but to chart long term support and resistance on the continuous chart. Where is the dividing line? That's a tough one; over the time frame of the above two charts is a grey area which I don't have an answer for.
In the end it depends how you trade and what your view of technical analysis. I'm more of a swing trader so the long term charts are more of an academic interest and do analysis on individual contracts, but that's just my way.
Something to be aware of for chartists.
However, some factors may make the deferred contracts price less than the nearer contracts. This may be lack of immediate demand for deferred delivery, new crop verses old crop supply, as a couple of quick examples.
This has ramifications when looking at charts over the longer term. When looking at a chart of a single contract where cost of carry has been priced in that cost will naturally decay as time goes by, similar to, but nowhere near the extent, of an options contract. This also affects the continuous chart. When one contract expires the next contract is simply tacked on to the continuous chart. The expiring contract's cost of carry will have decayed away to zero, while the new contract being added will have carrying costs reflecting the time till expiry.
Consider the two charts below. The first is The August 2007 contract and the second is the continuous contract.


Notice the difference between the two charts. The August contract shows the recent $70 resistance as have just been broken, yet the continuous shows resistance at a lower level. It also shows some other differences shown by the lower red line in each chart.
This is a profound difference for those used to charting share prices where such factor do not exist.
My approach is to chart short term support and resistance on the individual contract, but to chart long term support and resistance on the continuous chart. Where is the dividing line? That's a tough one; over the time frame of the above two charts is a grey area which I don't have an answer for.
In the end it depends how you trade and what your view of technical analysis. I'm more of a swing trader so the long term charts are more of an academic interest and do analysis on individual contracts, but that's just my way.
Something to be aware of for chartists.
28 June 2007
Oil above $70... Again
Yesterday we had the news of dwindling Gasoline stocks resulting in a nice setup for a potential flag breakout in Crude. Not surprisingly, demand on Crude has pushed the price up for both a technical break of the flag, but also overhead resistance at ~$70.
Longs will be watching closely at this level to see if they can break the $70 convincingly.
Oil Hits $70 a Barrel

Longs will be watching closely at this level to see if they can break the $70 convincingly.
Oil Hits $70 a Barrel

Is Gold Real Money, Or Just Another Bloody Commodity?
I've often pondered this question myself. From my own observations as an inveterate chart watcher, sometimes it behaves like money and sometimes like a commodity. A conundrum.
For some clarification on this Mick Shedlock has written a great article on this topic, check it out:
Misconceptions about Gold
The obligatory chart shows the August contract caught in this downward sloping channel with little swing trades possible of the declining support and resistance. In the absence of any meaningful trend in the bigger picture, this is my preferred way of playing Gold at the moment.

For some clarification on this Mick Shedlock has written a great article on this topic, check it out:
Misconceptions about Gold
The obligatory chart shows the August contract caught in this downward sloping channel with little swing trades possible of the declining support and resistance. In the absence of any meaningful trend in the bigger picture, this is my preferred way of playing Gold at the moment.

27 June 2007
Oil Chart Juicing Up
News on Gasoline stock released today:
http://www.philly.com/philly/wires/ap/business/8204342.html
This news bumped up the price to the upper edge of the little flag shown on the chart.

The obvious point of interest is whether this breaks out tomorrow and has another shot at $70 on the August contract
http://www.philly.com/philly/wires/ap/business/8204342.html
Oil Tops $68 on Gasoline Supply Concerns
J.W. ELPHINSTONE
The Associated Press
NEW YORK - Crude oil and gasoline prices rose Wednesday after a government report showed gasoline inventories unexpectedly shrinking last week.
Heating oil prices also increased after a surprising decline in distillate stocks.
Light, sweet crude for August delivery on the New York Mercantile Exchange gained 31 cents to $68.08 a barrel in morning trading. The contract had fallen $1.41 on Tuesday.
Brent crude futures edged up a penny to $70.18 on London's ICE Futures exchange.
Gasoline futures rose less than a half-cent to $2.2515 a barrel.
The Energy Department reported Wednesday that gasoline inventories dropped 700,000 barrels in the week ended June 22, contrary to the 1.1 million gain that had been expected by analysts polled by Dow Jones Newswires. Total gasoline stocks are well below the lower end of average for this time of year.
This news bumped up the price to the upper edge of the little flag shown on the chart.

The obvious point of interest is whether this breaks out tomorrow and has another shot at $70 on the August contract
A Change

Hi Folk, (This is not a typo, there is only one person tenacious enough to check this blog for new posts. That's my wife... and only cause I just told her.)
As intimated in an earlier post, I've been moving in the direction of commodity trading. I've been dabbling in commodities for some time while predominantly trading stock options, but over the last year things have changed. I've become predominantly a commodities trader who dabbles in a few stocks and their options.
There are a few reasons for this which I won't bore you with right now, but mainly I am attracted by the non-correlated returns offered by non-related commodities and financial futures.
You will have also noticed that I've changed the name of the blog. Obviously I wanted to reflect my change of direction, but also to out myself as a bear. (Those that know me know this already) "Trading the Apocalypse" seemed to reflect all the bullshit happening in the world right now. Wars, global warming, terrorism, mortgage fiascos, perpetual bubbles waiting to pop, all point to some "exciting times in the near future. Perhaps an apocalypse? Perhaps not. LOL
So what I want to do here is comment on whats happening in the various markets; of course throw up some charts on the action as well, nothing new there. But maybe I'll have a bit of a vent every now and again, bitch about house prices, make enemies on the other side of the political spectrum (wherever that lies), give out fuckwit awards, stuff like that.
Maybe even a stock of the day once in a while.
Anyway, this is purely for my enjoyment and as an outlet for my frustrations. If you feel like joining in (that is, if anyone apart from my Mrs reads this) please do so.
10 March 2007
Writing Commodity Options
A few of you still reading this infrequent drivvle of mine have mentioned the writing of options over commodity futures. I don't have enough experience with commodity options to be authoritative, but I have read what I think is an excellent book on the topic and it deals extensively with written options on futures.
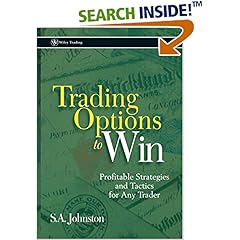
 This book is written by a bloke called Stuie Johnston. Some have criticized it for its conversational and irreverent writing style, but I found it not only occasionally hilarious, but very good at setting out a philosophy and methodology for premium collection on commodity futures.
Be prepared for a few statistics and discussion on seasonality... and especially what Stu refers to as NON-seasonal trades.
Check it out
He also runs a very good seasonal trading database site that if/when I have a crack at this, I will definitely subscribe to. www.timeandtiming.com (no financial connection blah blah)
 This book is written by a bloke called Stuie Johnston. Some have criticized it for its conversational and irreverent writing style, but I found it not only occasionally hilarious, but very good at setting out a philosophy and methodology for premium collection on commodity futures.
Be prepared for a few statistics and discussion on seasonality... and especially what Stu refers to as NON-seasonal trades.
Check it out
He also runs a very good seasonal trading database site that if/when I have a crack at this, I will definitely subscribe to. www.timeandtiming.com (no financial connection blah blah)
Subscribe to:
Posts (Atom)